

Part 2: Understanding false positives in patient data matching
[Part 2] of Matching Accuracy Metrics
Continue reading Part 1, Part 3, and Part 4
By: Austin Eliazar, Ph.D., Chief Data Scientist, HealthVerity
Read the full Matching Accuracy Metrics White Paper
Incorrect data links (false positives) are arguably the single worst flaw in a data set. Claiming that the records from multiple people all belong to a single individual ID can damage your analysis in subtle and insidious ways. Unfortunately, these errors are also the most under-reported and ignored, at least partially because they are difficult to detect and quantify in casual overview. In this section, we focus on why false positives are so dangerous and how you can measure them, even in anonymized data sets.
False Positives: In Depth
False positives mean that your data is lying to you. Unlike missing data or false negatives, which reduce your visibility or water down your effectiveness, false positives are actively providing misleading information. This misinformation is made all the more believable because it comes from real data from a real person, just not the one you want. Whether it is indicating an extra prescription, a false history of disease, or an entire duplicate medical history running alongside the intended one, this can affect your applications and analysis in very important ways:
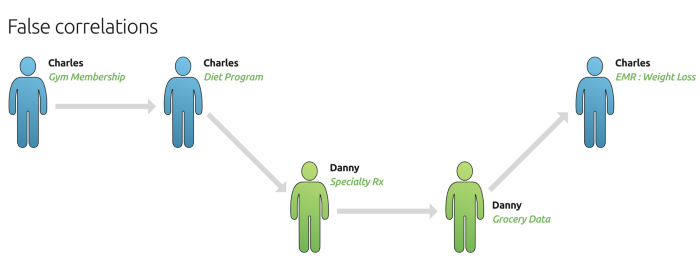
False correlations. Modern analysis methods and advanced machine learning methods are designed to find hidden or subtle signals in a vast sea of data. Unfortunately, that also means that they are prone to overfit to noise — that is to say, they can find random coincidences or focus on meaningless correlations and side effects instead of providing meaningful conclusions. False positives in the matching provide just the sort of structured errors that these methods are most susceptible to. Knowing the FPR (false positive rate) of your data can be instrumental in choosing the right methods that can gracefully handle the level of noise.
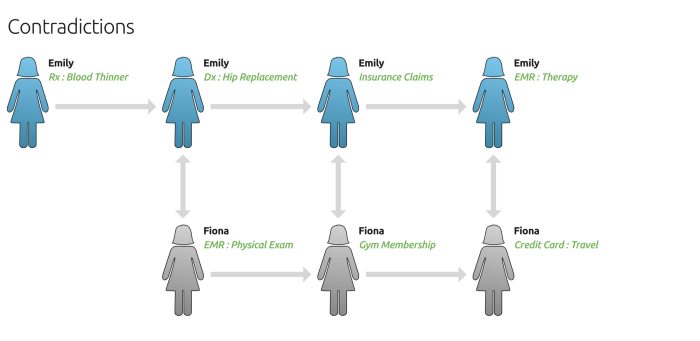
Contradictory data. Even outside of sensitive analytics, false positives provide bad information that leads to contradictions and the wrong decisions. For example, how do you target a patient that indicates both Type I and Type II Diabetes? Should you conclude that a recent heart surgery patient is recovered because their purchase history shows them at the gym? Quantifying the FPR can help you make sense of confusing data and make better decisions.
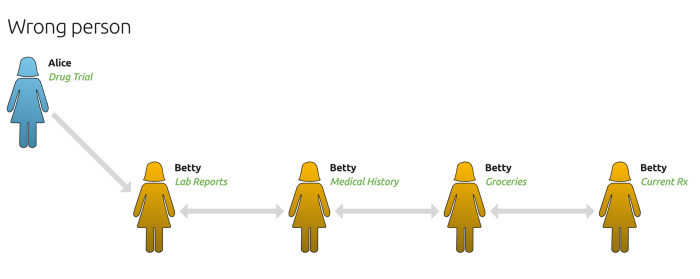
Wrong person. Not all false positives have a mixture of good and bad data. Often, the errors occur at the point of indexing. You may have one good piece of data — a key diagnosis, a risk assessment, or any targeted query — that needs to link to a rich history of data. When that first link is wrong, the entire conclusion is wrong. In many cases, from drug allergies to high-risk indicators to fraud alerts, these bad links can be disastrous. The FPR is doing more than assessing the data quality, it is driving contingency planning.
Measuring False Positive Rates
Post-Mortem Activity
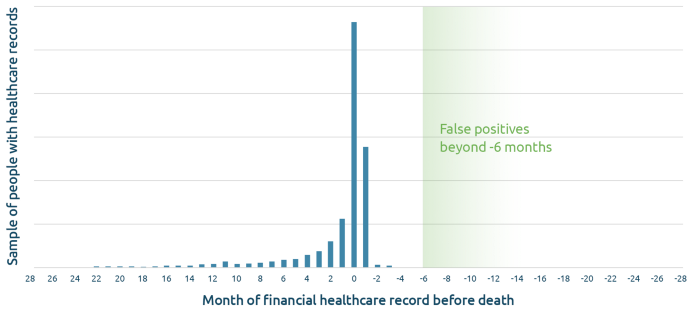
One effective way to measure the false positive rate is through the contradictory data itself, and nothing presents more a stark contrast than life and death. Once an individual has died, all activity for that identifier should stop. By observing the amount of post-mortem activity — records that are generated after a known date of death — we can directly measure cases of false positives. Read more on building mortality models using AI.
The measurements are straightforward: the sample group is the number of documented deaths in the data set, and the false positive count is the number of those individuals who continue to have records dated after the death date.
Observed FPR = (false positive count) / (sample group size)
This provides a simple, clean, and direct measure of the FPR. However, there are always a few considerations worth noting:
Death events and trickle off activity. Be aware that some record activity after the death date is normal. Not all records are completed at the time of the event, some activity is still pending, and some records — including the death date — may be recorded imprecisely. Therefore, it is typical to allow a reasonable grace period of three to six months before counting activity as indicative of a false positive. If there is an actual false positive, record activity should continue well after this interval.
Control for normal inactivity. Depending on the nature and breadth of the records in the system, periods of inactivity up to 12 months or more may be normal for an individual. This could lead to underestimating the number of false positives, since lack of activity doesn’t necessarily mean there isn’t another person attached to that identity in the system. Knowing how much inactivity is normal can help give a more accurate FPR.
It is best to choose an amount of time, such as 12 months, that you will use when looking for activity. This is the activity window — you expect most people won’t go longer than this amount of time without showing some activity in your system. First, you want to make sure that everyone you use in the observed FPR has enough time in your records for a full activity window after their death date For example, if you are using a 12 month activity window and your records cover through May 2019, then you shouldn’t include anyone with a death date after May 2018 in the observed FPR. Next, you want to figure out what the average amount of activity is for any typical activity window. To find this number, pick a fixed time interval in your data that is the same length as the activity window. Count the percentage of individuals who have at least one record during that time interval. This activity percent will improve your estimate of the FPR:
Estimated FPR = (observed FPR) / (activity percent)
Other Change Events
Not all systems have access to death dates, either due to availability or privacy reasons. There are other indicators that can be used as change events in a similar way, however beware of the often less definitive nature and potential complications. Below are some of the alternate change events that can be used to measure FPR with some of the other more common record elements.
Change of address. While not as definitive as death, a change of residence is another persistent demographic that can reveal divergent records and quantify FPR. A change of residence can be used in the same way as death dates; once a person has moved — allowing for a grace period — his or her future records should continue to reflect the new residence and should not revert back. The change of residence can be flagged at any granularity, from street address up to state/province or country. However, we find that 3-digit zip code works best in the US — simple enough to minimize typos, small enough to observe a decent number of change events, and broad enough to often be available as plaintext in de-identified data sets.
Using change in location does have its own set of problems. False positives can be overcounted due to temporary residences or multiple homes, which can often be seen in groups like students, military personnel, contract workers, and retirees. On the other hand, undercounting is also an issue, especially within a family unit. Parents and siblings — especially twins — are particularly vulnerable to producing false positives, as the data is often very similar. Unfortunately, these family members often move together, producing the same change event for both of the people who are (incorrectly) sharing an identity. Many matching methods do a poor job of tracking a person through a change in residence and if this is regularly missed, false positives will be significantly undercounted. So, while change of residence is an attractive measure due to the readily available nature of the data, it is often a noisier measurement and not well suited for accuracy.
Name change. A person’s name is another persistent indicator to watch for changes. The first name may be mutable due to abbreviations, misspellings, and nicknames. Therefore, getting a good understanding of these changes can be almost impossible in an anonymized matching system. Instead, we recommend focusing on changes to the last name. These tend to be temporally persistent, the result of a marital change or other momentous event. However, they also tend to be difficult to match across, so the indication of a change will likely come from an outside source, such as a data provider who is directly aware of the change. Just like any other change event, the effects can take some time to be seen across the data. In some cases, the data won’t be updated until there is another change as well — a change in insurance, healthcare provider, or pharmacy location. If a new site continues to carry the old name information, that can be a strong sign of a false positive.
Measuring false positives through name change is challenging and often less reliable than other indicators. The grace period often needs to be much longer than an indicator like a death event, as some people may not update their information everywhere and continue to use their old name for years. Careful consideration needs to be taken when deciding if the data sets covered by the matching system are appropriate to measure using name changes, and what the amount of expected noise might be.
Continue reading Part 1, Part 3, and Part 4
Interested in learning more about matching accuracy?


